Buy-and-Hold or Miss The 10 Best (+ Worst) Stock Market Days
Updated on October 25th, 2023
Whenever market volatility crops up, the financial press starts shilling the commentary from asset managers about staying the course with the buy-and-hold strategy peppered with “time in the market not market timing” platitudes. Almost every time I come across one of these buy-and-hold vs trading articles, it’s basically guaranteed to have some variant of “what happens if you miss the 10 best days in the stock market?”
And, of course, the answer is always that you would have done significantly better with buy and hold investing rather than selling for some reason and going back in later. Does anyone ever stop and ask why you would only miss the ten best days and none of the worst days? That seems a little biased. Let’s really see what happens.
Who Is Buy-and-Hold Good For?
Buy and hold investing is good for people who do not have the time, inclination or confidence to do more than the bare minimum of investing. This is completely okay.
Is Buy-and-Hold Still a Good Strategy?
Buy and hold works over the very long term if you can stomach the volatility and are okay waiting potentially years to get back to even.
For those familiar with my website, I’m a big proponent of being tactical in the stock market. While I would never recommend anyone take all their money out of the market at any given time, I have definitely advocated for people taking risk off the table when it was prudent to do so before the world is falling apart, not after.
With fixed income yields the highest they have been in 15 years, an investor’s allocation mix should be reexamined and rebalanced accordingly to their risk tolerance. TINA is no longer the only girl in town (for those not familiar with the acronym, it means ‘there is no alternative’ to stocks), and bonds act as a counterweight to market volatility.
One month treasuries are yielding 3% annualized and I-Bonds are yielding 9.62%. These are great risk free returns that haven’t been this good for about 15 years!
Why The 10 Best Days Myth Is Misleading
The part that always bothered me about the “missing the 10 best days” claim of why you should buy and hold stocks is that somehow you’d only miss the best days if you took money out of the market. Notice anything in particular about the best daily returns since 1993 (Yahoo Finance data)?
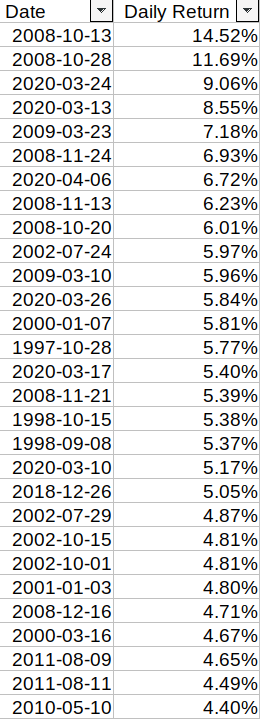
The best days coincide around the same time as the worst days because the best days stem from market volatility, not melt ups. Sometimes the best and worst days are the next day, in fact.
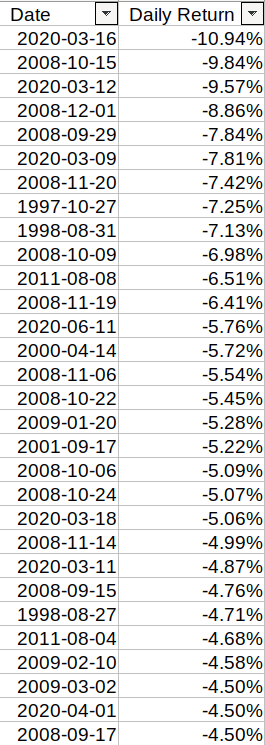
So the argument pushed by the asset managers is that you’d somehow sell your stocks the day of a big market washout and then buy them back the day after a large gain and do this consistently without missing any of the bad market days. This argument is stacking the deck in favor of the buy-and-hold investment strategy.
If you are closing out your stock exposure because of volatility or another reason, isn’t it conceivable that you’d miss some of the bad days too? I think so, which is why I wrote this article. I was curious what the stock market performance would look like if you missed the 5, 10, and 20 best and worst days.
Stock Market Performance After Missing Best and Worst Days
As a baseline, if you had invested $1,000 in the S&P500 through SPY and reinvested the dividends since Jan 1993 until September 2022, you’d have $14,380, for a compounded return of 9.41% a year, which is inline with the historical average. Nothing is wrong with buy-and-hold over long periods of time.
Instead, if you somehow missed the 20 best and worst days, your final balance would be $16,243 for a compounded return of 9.86%.
If you missed the 10 best trading days and the 10 worst trading days, your final balance would be $15,602 for a compounded return of 9.71%.
And, if you missed the 5 best and worst days, your final balance would be $34,480 for a compounded return of 12.69%!
It’s actually quite remarkable that you can miss just 0.13% of all market trading days and improve your return enough to more than double your final account balance over nearly 30 years.
Of course it is silly to assume that you’ll be able to pick out the 5, 10, or 20 days beforehand. But what does this tell you?
Avoiding the downside is more important than missing the upside for your long term investment strategy, and the reason is the volatility drag. What I mean is that if a $1,000 portfolio gains 25% and then loses 25% (or first loses and then gains), the portfolio isn’t back to $1,000, it’s down to $937.50. What ‘avoiding the best and worst x days’ shows you is that the skew of the portfolio is reduced.
So how might we implement something like this?
A Simple Strategy To Avoid the Best and Worst Days
So we have established that the best and the worst days occur around the most volatile times and that taking risk off the table during these times can lead to outperformance over the long term. So how could we do this without knowing the future? The answer is a very simple strategy of following the trend.
Now trends can be established many ways and what I present just shows the power of a simple idea in technical analysis. It’s not a new idea and various funds and professional traders take it into consideration on both the S&P500 and individual stocks: the moving average. The idea is simple, you buy when prices are above the moving average and sell if below.
Some use a 200 day simple moving average and others use the exponential. Some might use the 150 day or the 250 day and trade daily, weekly, or monthly. There are many ways to skin a cat and each method will have its own pro’s and con’s but ultimately they all accomplish the same thing: you are out of the market when it is going down.
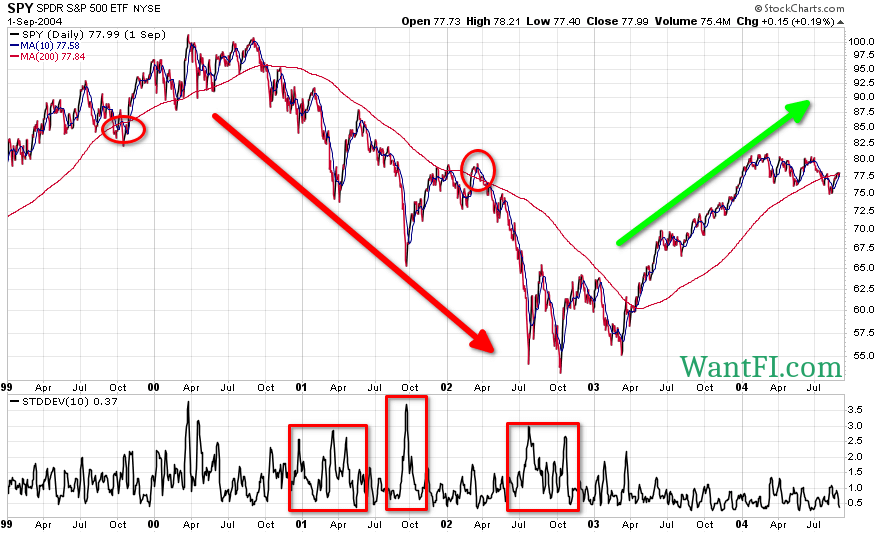
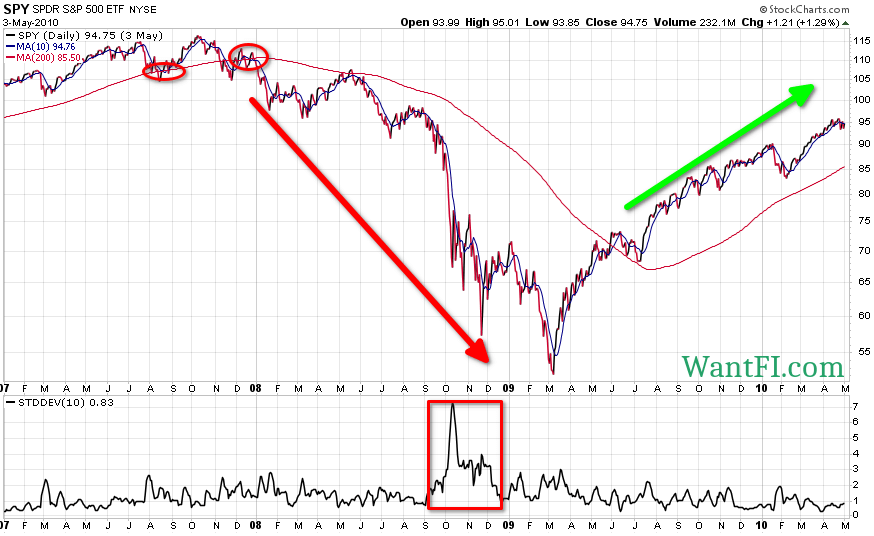
The two worst drawdowns in recent history were 2008 and 2000 which both saw the stock market cut in half by the time the damage was over. The most volatile times were also while the market was trading under the 200 day moving average, which if you refer back up to the tables above, you will see many of the dates for the best and the worst daily returns listed.
Having a single moving average for your signal can lead to a lot of chop trading and false positives around the line, so I prefer to use two moving averages which slows down the buying and selling: the 10 day moving average and the 200 day moving average. This works similarly and all you do is wait for a cross-over of the fast moving average and the slow moving average. Buy the S&P 500 and hold it when the 10 day moving average is above the 200 day moving average and sell it otherwise. You still get a little chop and false positives, but you can see below that it dramatically cuts them down, circled in red.
The best part of this strategy is that you avoid the worst parts of a large downward move and usually the greatest volatility.
This is only one tool in the toolbox and most traders use a collection of signals to help guide their decisions.
200 Day Moving Average Strategy Results
So now that we have established the strategy, how does it perform?
The final account balance over the same time period is $14,109, corresponding to a compound return of 9.31%.
Right about now you are probably thinking “wait a minute, this final account balance is smaller than the buy-and-hold investment strategy!” And you are right, but two points: there were several years of down periods where the account was just holding cash and earning 0%. During these periods it was conceivable that the investor would have earned at least 2% annualized in short duration bonds which would have increased the compound return somewhat.
PRO-TIP: I rolled over a 401k into an IRA, and Capitalize‘s FREE service couldn’t have made it any easier to do. They work with all the major brokerages and handle the paperwork for you.
Secondly, what I haven’t shown you yet is that the strategy had 30% less volatility and almost a two-thirds less drawdown risk. What this means is that you can lever up the simple 200/10 day moving average strategy to the same level of volatility as the buy-and-hold investment strategy and capture more return and less downside risk.
The leverage necessary to equate the volatility to the buy-and-hold strategy is about 1.5x. A simple way to implement this would be to either use margin from your brokerage (likely too expensive), employ futures contracts depending on the size of your account (very efficient), or stash half your stock cash in treasuries and half your stock cash into a triple levered fund such as SPXL (technically this wouldn’t be exactly 1.5x because of daily re-balancing, but pretty close).
Graphically, the return series look like this:
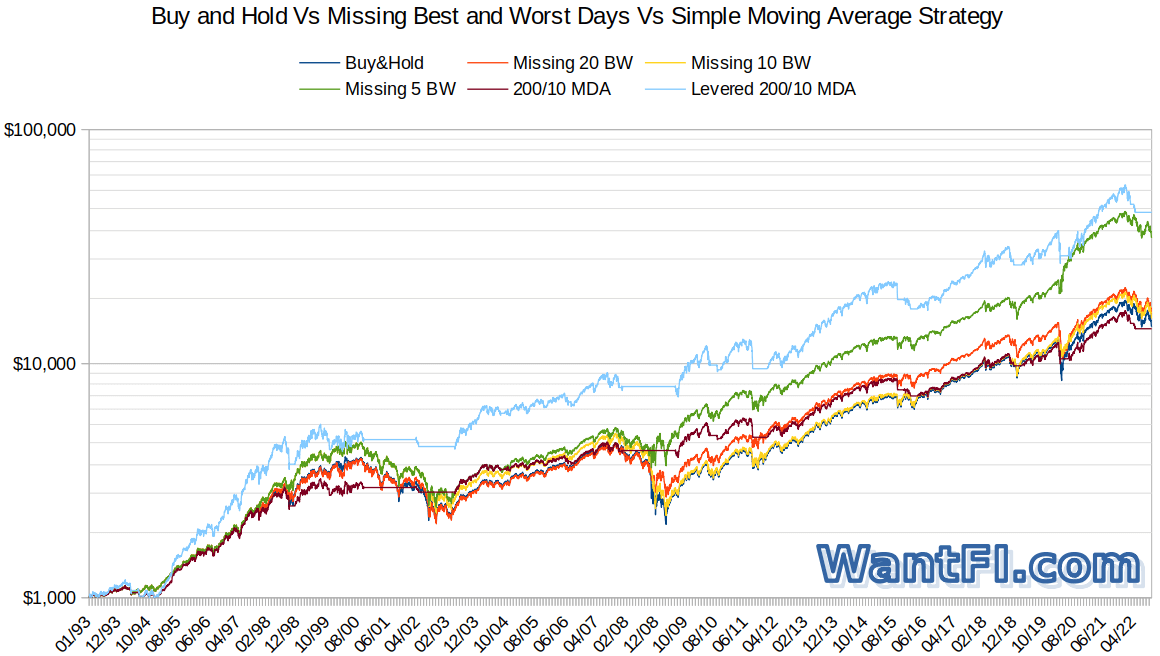
Notice how the levered 200/10 day moving average strategy bests even the 5 best and worst trading days ‘strategy’ that requires impossible knowledge of the future.
In tabular form, the following shows the compound annual returns, worst drawdown, annual volatility and return on risk. Return on risk is essentially the Sharpe Ratio, but using a 0% risk free rate during the entire period.
Even using 1.5x leverage, the worst drawdown was less than half what the buy-and-hold investor would have had.
Now, market frictions such as transaction costs, slippage and taxes would reduce the aforementioned moving average strategy results a bit, but with most brokerages offering $0 commissions and the bulk of most people’s investment funds inside retirement accounts, many of those frictions could be reduced or eliminated.
If you want to read more and see various statistics on leverage and the 200 day moving average, check out the published paper that uses a similar but a slightly different strategy.
Closing Thoughts
The point of this analysis is to show that while buy-and-hold works well over long periods of time, a simple technical analysis trading strategy can outperform it with less risk, better drawdowns, and be completely out of the market during the most painful times when everyone else is panicking and feeling stressed out. Of course you would probably only apply it to a portion of your stock holdings, but the point is for exposition.
The cost of missing 10 best days in stock market is only a problem if you missed the best days and none of the worst days which would be a statistical impossibility. That argument is a stacked deck in favor of being in the market at all times.
The trading strategy presented here takes risk off the table when it is prudent to do so without knowing anything other than the price action. Even without using a technical analysis trading strategy, sometimes there are very good reasons for taking risk off the table. If you have been following my blog, all last year I was showcasing why the stock market looked like a bubble and mentioning the risks of inflation, lack of risk control and extreme stock market valuations.
Using economic knowledge combined with a technical trading strategy can give you the confidence to execute it without doubting yourself.
I am not saying that you should implement this strategy but hopefully it gets you thinking differently about investing and that buy-and-hold isn’t the only game in town. As always, past results are not indicative of returns for the future.
Come join my Telegram chatroom for live market commentary.
Free Investing Tools
- Have Capitalize handle the paperwork for your 401K rollover to any brokerage, for FREE!
- Where does your money go each month? Track all your accounts and see if you are on track to retirement with Empower, for FREE! I use it myself to monitor my mom’s accounts to make sure she isn’t falling for scams or being defrauded.
