The Stock Market Bubble Will Pop: What 20+ Ominous Signals Show
There are dozens of stories floating around the web of people getting rich through stock market speculation in this bull market by trading options or using highly concentrated portfolios; highly concentrated portfolio with 1 stock, that is.
In fact, there is a whole community on Reddit that is dedicated to this “YOLO” style of trading equivalent to going to a casino and putting all your money on black 15. There’s the guy who turned $53,000 into $11 million $25 million, $44 million, in a year by buying Gamestop call options. And there’s the guy who bought a few thousand dollars worth of Tesla 10 years ago and it’s now valued at $12 million.
The best way I can describe what we are seeing right now is a speculative mania. The question is, is there a stock market bubble? I would answer a resounding yes and will show a collection of signs of a market top. Of course in the meantime, the bubble can continue to get bigger since people are buying and trading like there is no risk at all. That can change at a moment’s notice though as exemplified by the February 2020 stock market crash that took the markets down 35% in a few weeks.
I first discuss why sentiment is so high right now.
It’s always the winning stories that inflate the bubble as more people rush in to cash in on the riches.
This is the psychological problem with these kinds of stories: they entice others to take the same kinds of risks. Hey if Joe Blow can do it, why can’t I? Fear-Of-Missing-Out (FOMO) is a powerful force and creates a black hole with a gravitational pull that brings in a lot of new money into whatever is creating these great riches. This is how bubbles form.
When enough people buy lotto tickets, there are going to be big winners. If enough people gamble at a casino, there are going to be big winners. Statistically, if 10,000 people go to the casino and put $10,000 on black 15, 263 of them are going to be winners. And then 7 of them are going to win twice in a row. Since the payout is 35 to 1, after factoring in the house edge, for those who win twice in a row, the return will be 1,224% ($12,250,000).
Winner, Winner, Chicken Dinner!
These hypothetical guys aren’t expert roulette wheel players just like the YOLO players cropping up all over the web aren’t genius stock pickers. They got lucky, whether they know it or not. Everybody is a genius in a bull market.
You have to ask yourself at what point will they stop and cash out their winnings and be set for life? If you have $10 million, what’s another million or two really going to do for you?
The “Teslaire” portfolio has million dollar swings. This style of “investing” works great when the market is going straight up, but let’s check back when a grueling bear market arrives.
Too Much Confusion Of Gambling and Investing
Of course the first attempt at a critique will be that buying stocks isn’t the same as gambling. Sure, when stocks seemingly only go up, it doesn’t seem like gambling because there is the illusion of no risk. Even though people can look at historical charts to see long periods where markets have gone down or nowhere, personal experience is really the greatest teacher.
Ask yourself if would you buy a company for $100,000 that only generates $3,333 of sales each year? Sales, not profits. That’s basically what Tesla is as a stock.
Okay, so sales are forecast to expand rapidly because they have introduced a new and exciting product that will change the world.
Let’s say that the sales will quadruple over the next few years. In that case, is paying $100,000 for a business that has $13,332 in sales still a good deal to you? At what point would you want to make a profit? Remember there are still employees to pay, factories to run and stores to maintain. Tesla’s profit margin is 2%, according to Yahoo, so 2% of those sales is $266 in profits, per year.
That’s not a deal I would want to make.
Dawn Of The Robinhood Traders
I’ve previously written about why people should avoid the Robinhood brokerage platform, but Robinhood traders get a bad name because they are generally inexperienced traders & investors from the millennial and generation-Z cohort. Most of them have only been trading for a year or two and haven’t experienced a real bear market. None seem concerned about stock market risk factors as the market has only gone up since they’ve started.
Millions of new Robinhood accounts have been created in the last year and it’s all new money flooding into the markets with much of it is straight from the government stimulus checks. Usually when the mass retail traders open up accounts and start piling in, the end of the bubble is near.
There was a website known as Robintrack that used to show what positions Robinhood accounts had, but it was turned off over the summer of 2020. However, it showed some interesting insights into what they put into their portfolios. They had a preference for buying the riskiest stocks, even stocks that had already declared bankruptcy! Hertz rental car even proposed a secondary offering after they had declared bankruptcy because of all the demand for their stock after the fact. That was a first.
They also trade A LOT. Why? Some insight below.
Momentum Trading
Their primary strategy seems to be piling on stocks that are going up aggressively. Momentum is not a bad strategy overall, and it works great while markets are trending up. Even I created an institutional product at a previous employer that was based on momentum and had hundreds of millions of dollars in assets riding on it.
Of course, momentum doesn’t work as well during choppy markets, but we haven’t seen too many of those in the last 8 years due to Federal Reserve Quantitative Easing X activity.
The iShares Momentum Factor ETF has performed exceptionally well compared to the S&P 500:
However, Robinhood traders aren’t just buying and holding stock, they are levering up the bets using deep-out-of-the-money call options.
Robinhood Trader Case Study
The concerning thing is the level of risk being applied.
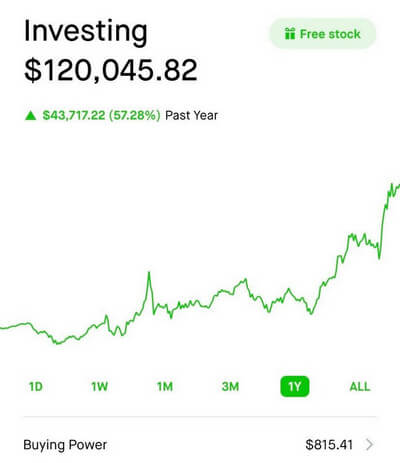
My friend started trading options last year and she picked a good time to start trading options because after the market corrected it has basically gone straight up since then.
She’s made a killing of 57% over the last year (as have lots of other call option traders, which creates the cycle of drawing others into the game!).
Most of the advance appears to come after November when the vaccines were announced setting off huge surges in stocks.
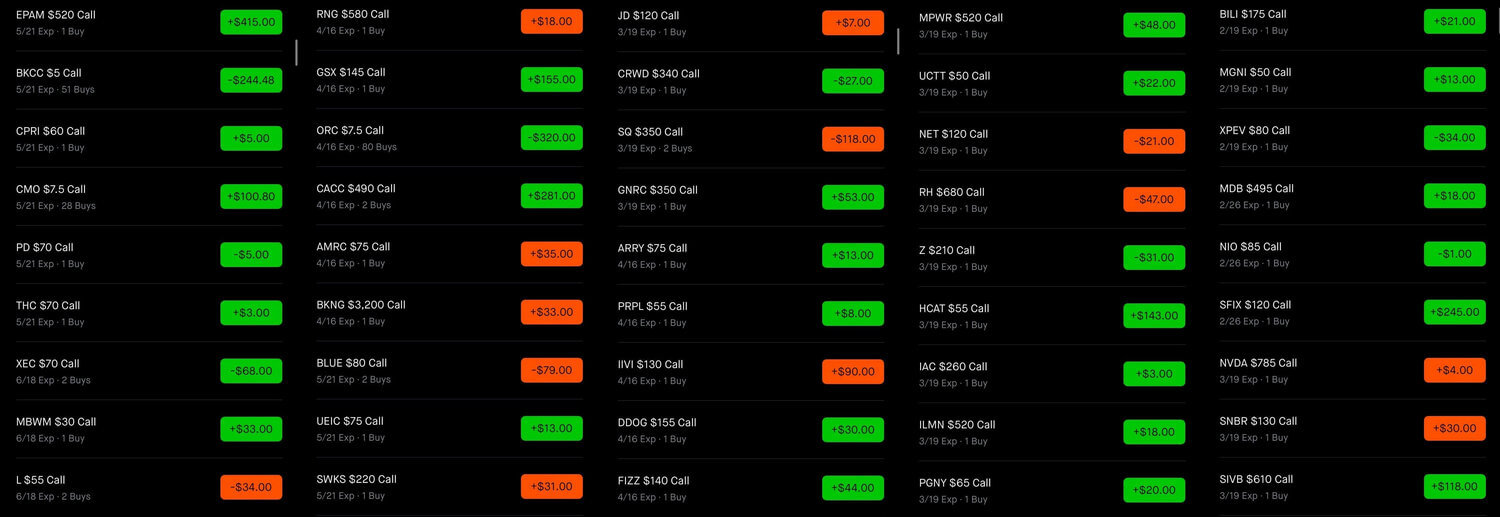
But here is the problem: the entire portfolio consists of deep-out-of-the-money call options on 200 stocks.
Firstly, could you imagine trying to have a full time job and managing 200 positions? I honestly couldn’t even tell you what most of these tickers represent without first looking them up and I have researched hundreds, if not thousands, of stocks. This is a huge number of positions to manage.
PRO-TIP: If you are US based, trade cryptocurrency and want to avoid the tax hassle see the Alto Crypto IRA. They support 150+ coins, there are no monthly or annual fees, no LLC setup fees, no processing fees, and they charge only 1% on each trade. Any cash waiting in your account is insured by the FDIC.
Secondly, each call option requires a stock move of +50% to 100% in the next couple of months, otherwise the premium is lost. Now she told me she doesn’t hold them to expiration and as they move up she either sells them for some profit and moves on to a new name or raises the strike and locks in a little profit. However, this requires a constantly ascending market. And pauses in the uptrend or *GASP* a market that briefly goes down will be very bad news.
Thirdly, I looked up many of the names and found that most of the stocks in this portfolio have GAAP losses or are barely profitable with P/E’s > 60.
It’s basically a portfolio of lotto tickets. Super high risk, but super high reward if the market keeps moving up. YOLO?
This of course is just one story, but if you follow the TikTok investors or the Reddit forums this seems to be the norm with this new breed of option trader lured in by the free commissions of Robinhood.
Signs of Stock Market Bubble Excess
So let’s begin.
There is no dearth of signs of speculative excess. These are a necessary, but not sufficient condition for a big market correction which we see once every decade. I’ll quickly run through these stock market risk factors as they are pretty self explanatory.
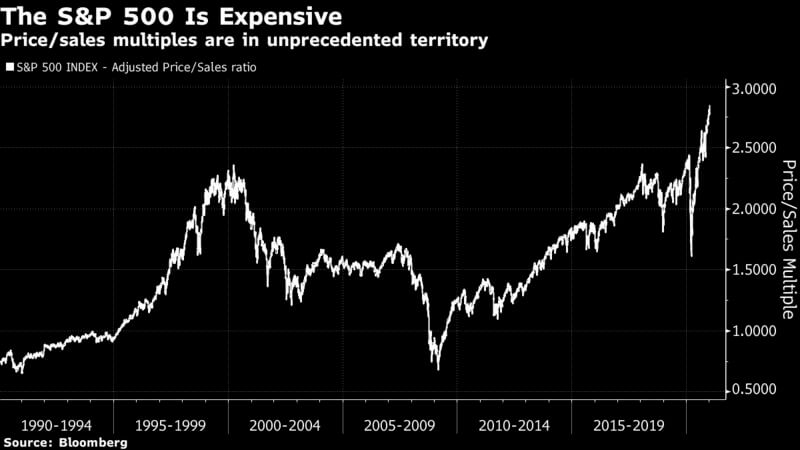
The Price-to-Sales ratio is now greater than the 1999 Tech Bubble:
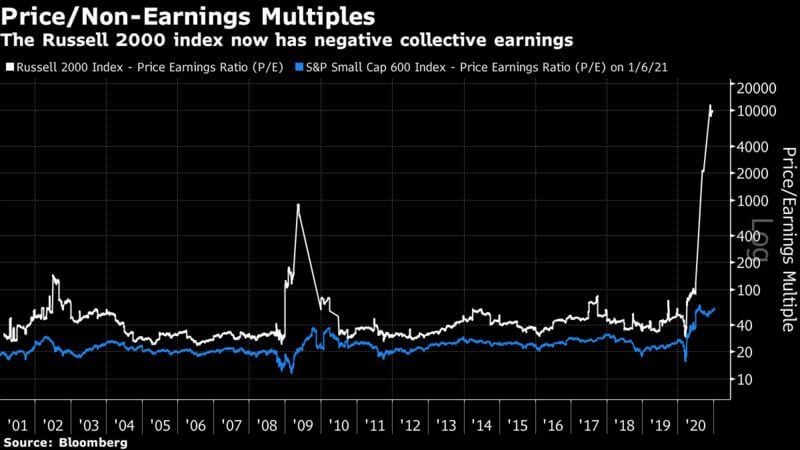
The price-to-earnings for small caps is off the charts. P/E of 10,000?
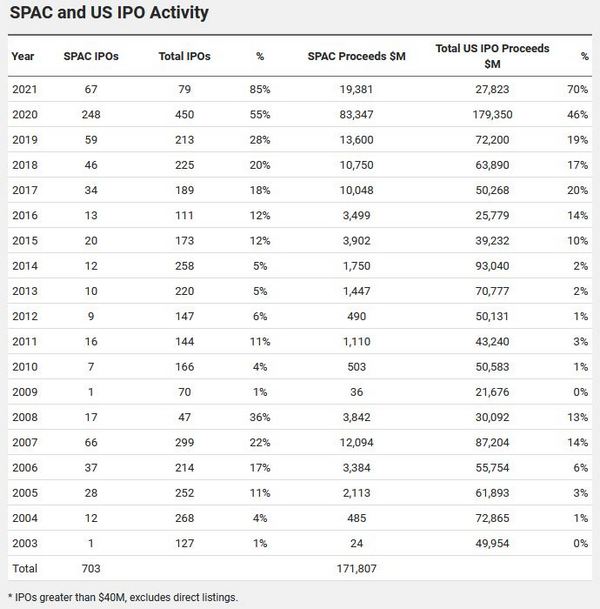
There is a frenetic pace of people throwing their money at IPO and Special Purpose Acquisition Companies (SPACs).
SPACs in particular are comical: You give me a bunch of money and I will go buy a company with it. I pick the company!
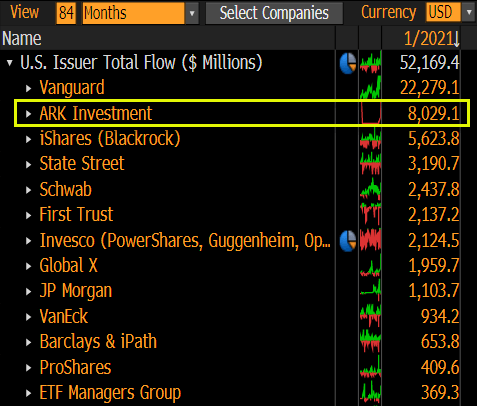
One of the best performing ETFs that has large positions in Tesla and other “innovative” companies has increased assets under management (AUM) 20x in a year. This is unprecedented growth.
In January alone, it has had more fund flows than BlackRock, State Street, Schwab or any of the remaining players.
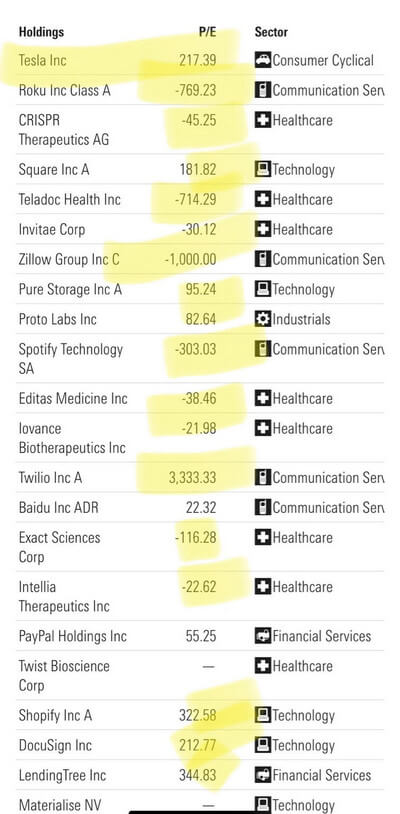
Morningstar shows that almost every company in the portfolio is either not profitable, or the earnings are negligible compared to the valuation. It’s a portfolio of stock bubbles:
But it’s not only that, sellers on ETSY are actually creating merchandise for these ETFs and founder. That’s definitely a first.
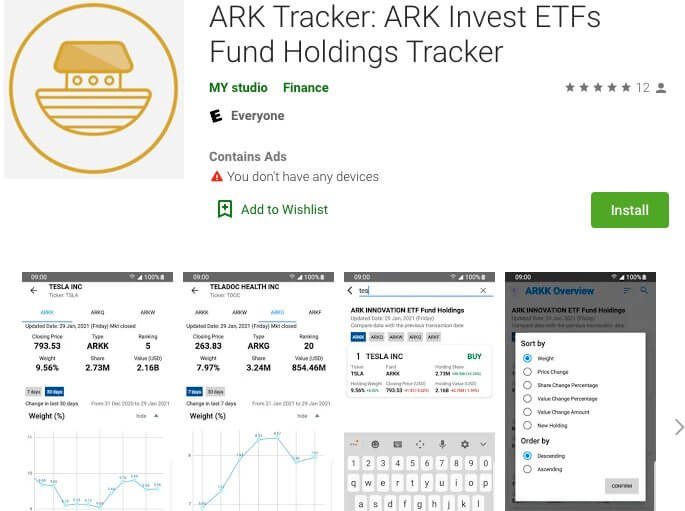
There is even an ARKK holdings tracking app (which is redundant since they publish their holdings almost daily on their website). But how many times have you seen an app created just to track a single fund’s holdings?
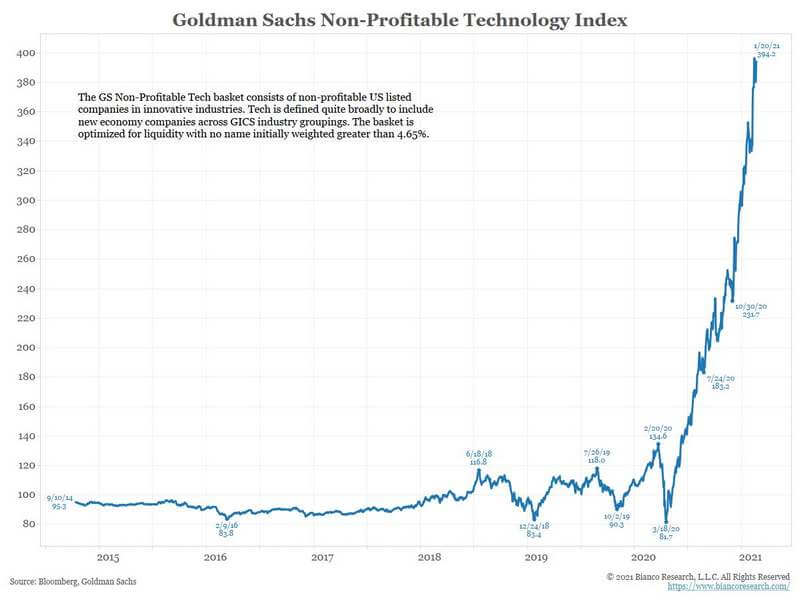
Speaking of non-profitable tech companies, this return chart closely matches the ARKK returns:
I guess profits aren’t important for investing anymore, another sign of a bubble.
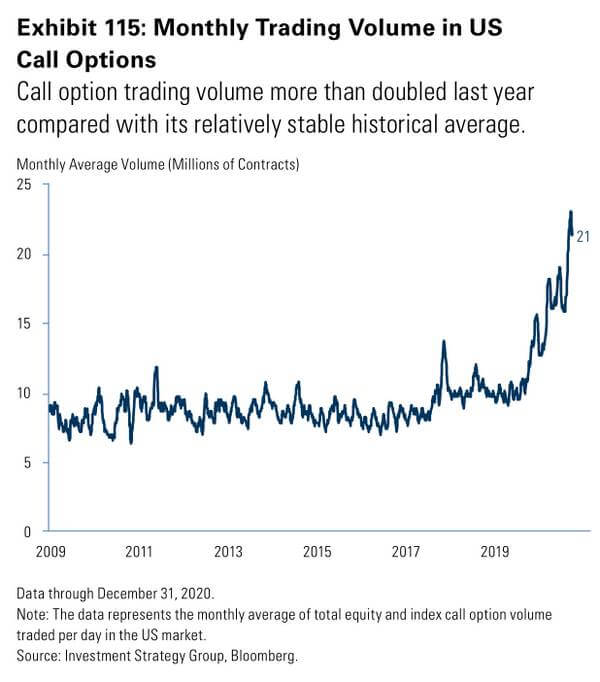
Option speculation has gone through the roof:
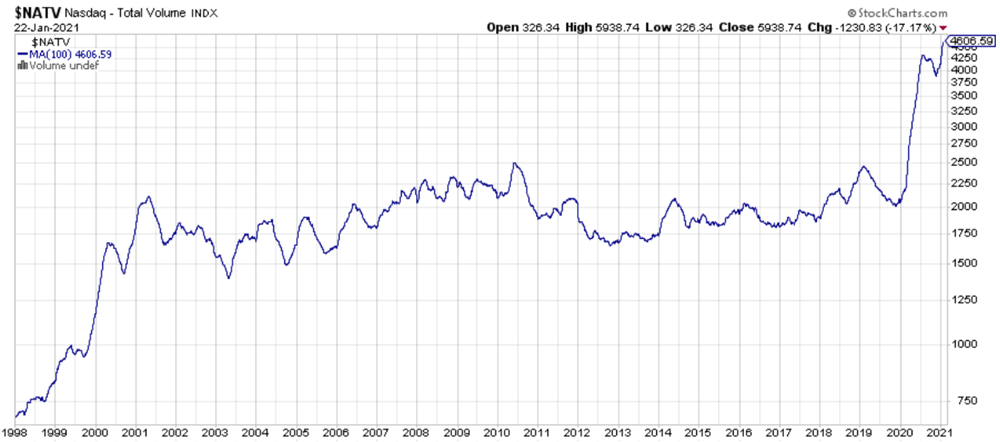
Nasdaq trading volume itself soared in 2020:
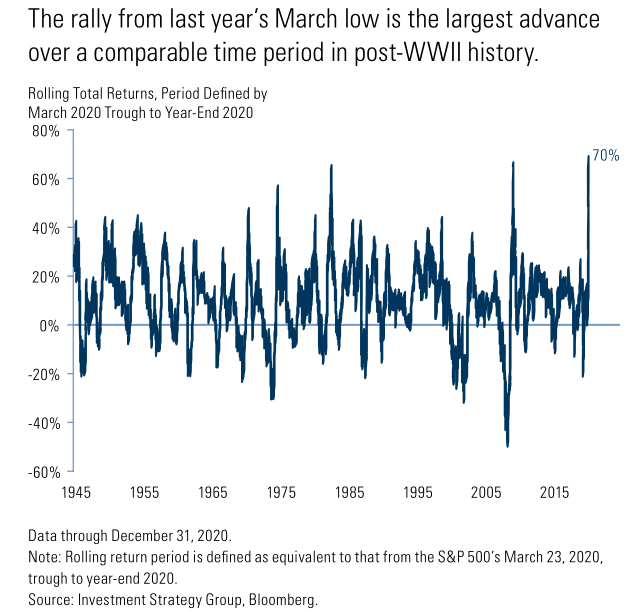
The return from the March low has been the largest advance since WWII… in the middle of a recession.
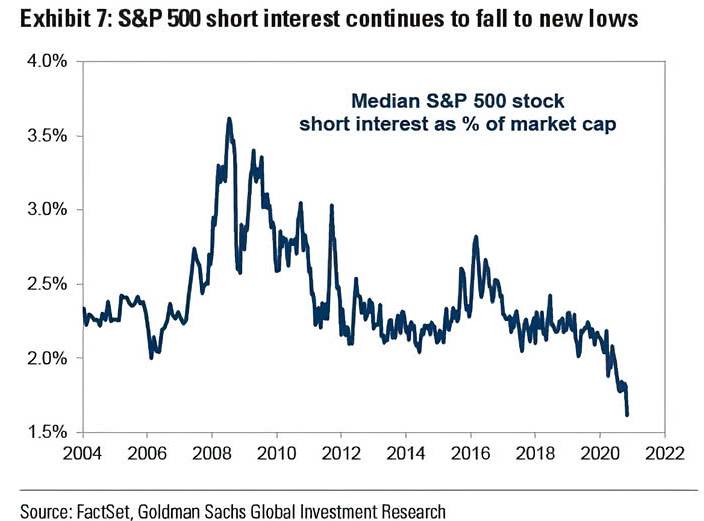
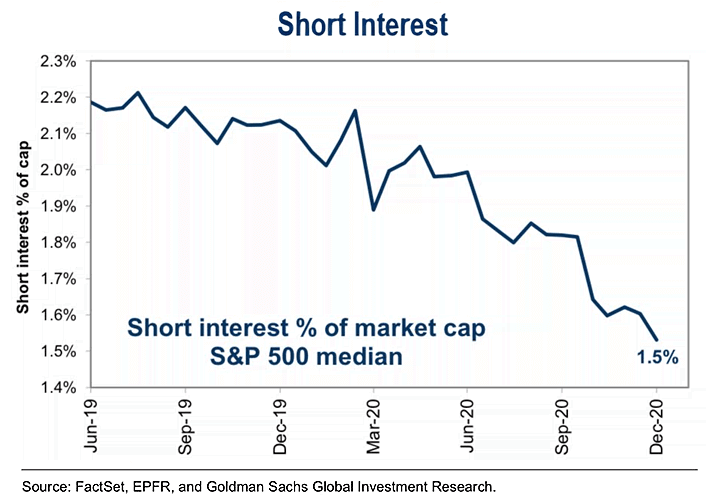
Short interest is the lowest it has been in years:
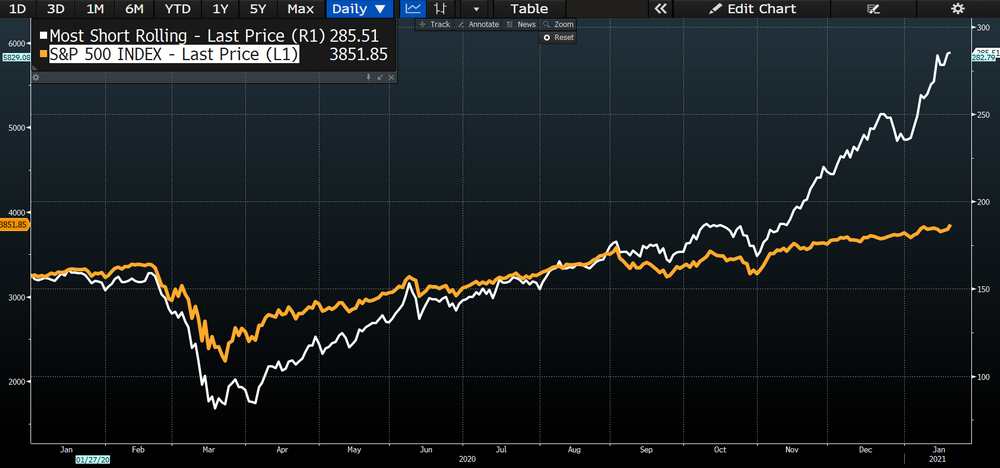
And this is probably because targeting short squeezes has become a coordinated Reddit strategy that has outperformed:
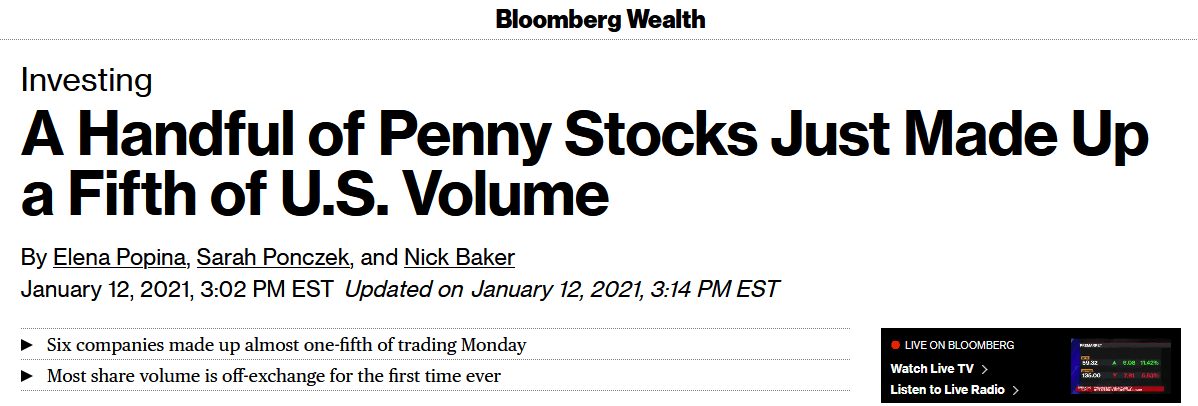
Penny Stocks are all the rage again which saw the same activity during the 1999 Tech Bubble:
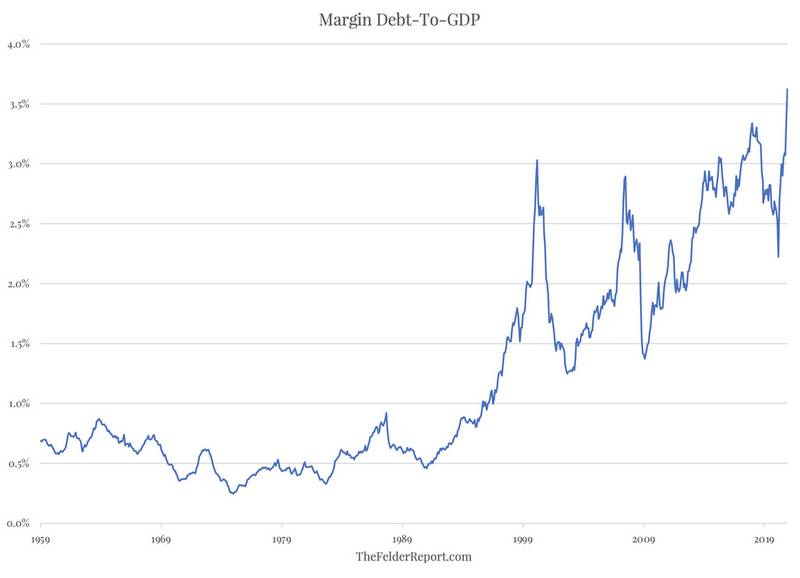
I don’t like the margin-debt-to-market-cap chart because it rises and falls with the valuation of the stock market and is a coincident indicator. More margin puffs up both the numerator and the denominator and it is hard to tease out over and undervaluation. However, the margin-debt-to-GDP shows how much leverage is in the stock market compared to the overall economy. GDP is not influenced by margin, whereas market cap is. Again, it’s at record highs.
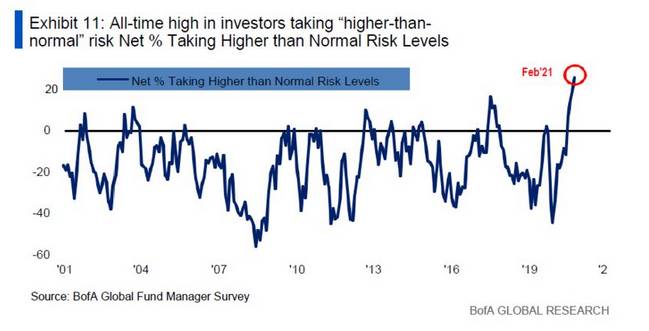
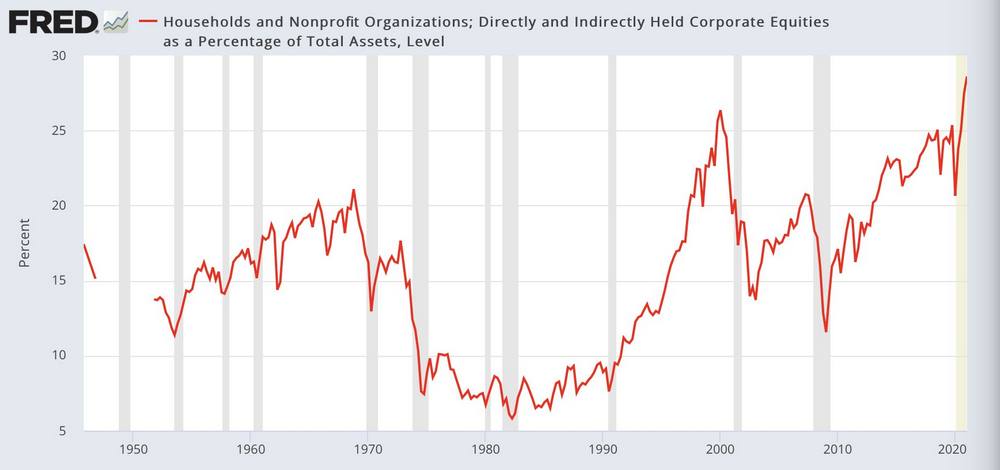
There’s an all time high of investors taking “higher than normal” risk.
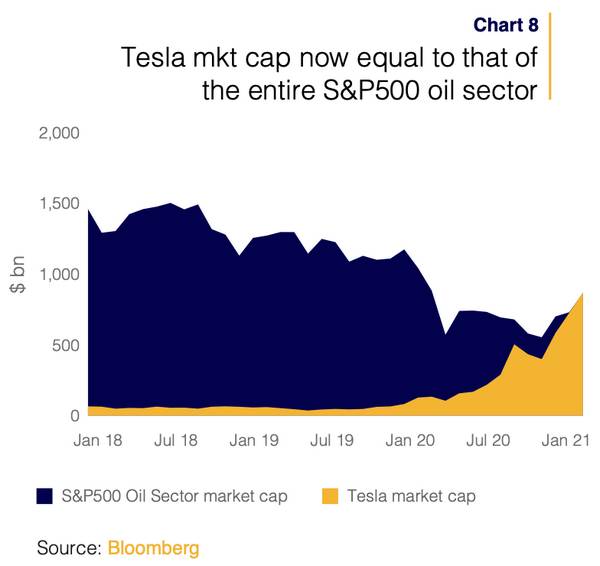
Back in January, Tesla’s market cap was equal to the entire oil & gas sector. Tesla itself is in a bubble.
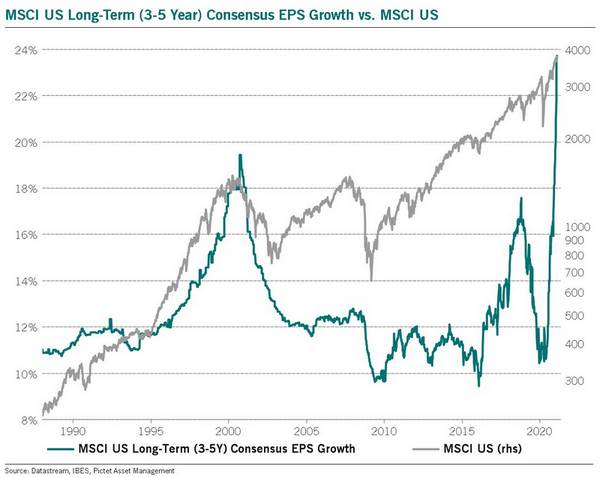
Analyst EPS growth targets are projecting the greatest economic rebound in 30 years, even though the pandemic will continue to hamper the world economy for a while and variant virus strains resistant to the vaccines might emerge.
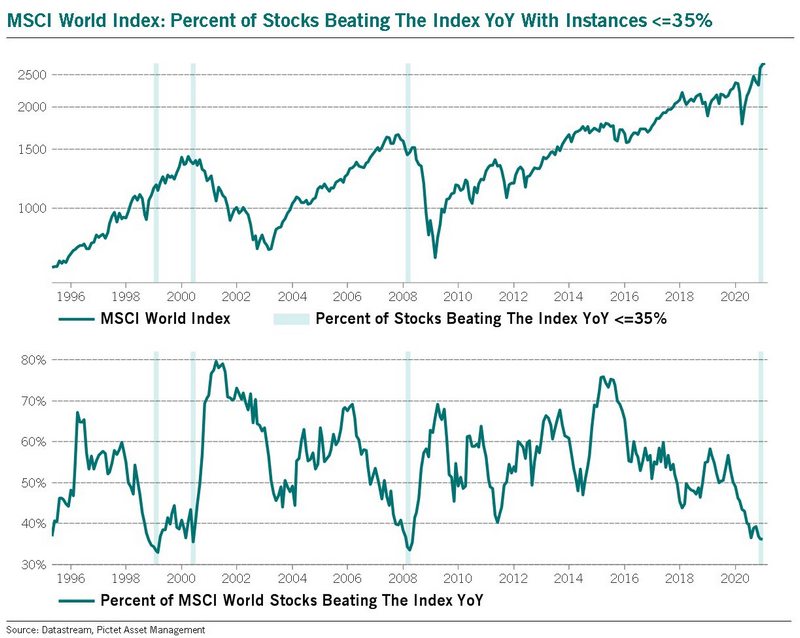
And this is an interesting chart. The breadth of stocks in the MSCI world index beating the index has fallen to under 35%, meaning that only a handful of stocks are driving the MSCI world returns. This does not happen frequently, but the last few times it has happened it has portended major tops.
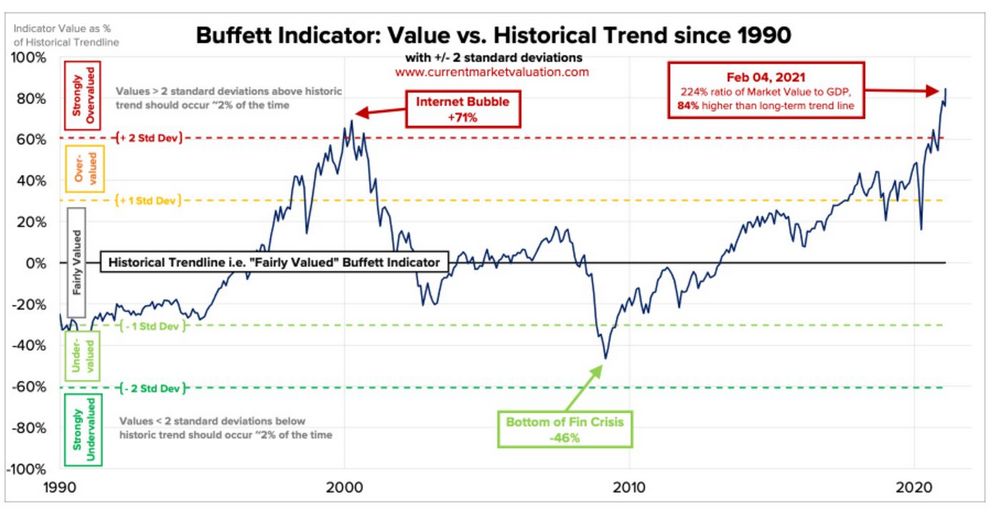
The “Buffet Indicator” is Warren Buffet’s preferred indicator of of whether the market is overvalued or not by comparing the market value of the Wilshire 5000 to the Gross Domestic Product. The stock market valuation is worth more than twice as much as the GDP, which is higher than during the tech bubble, as shown by the chart.
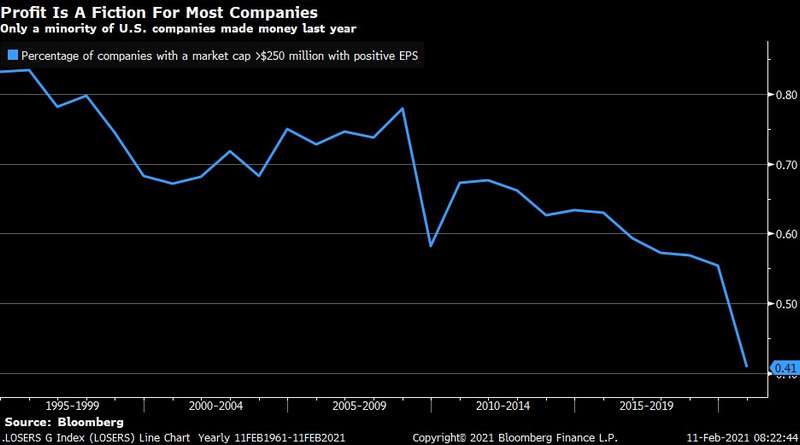
Only 41% of companies greater than a $250 million market cap had positive EPS last year (down from 55% the prior year).
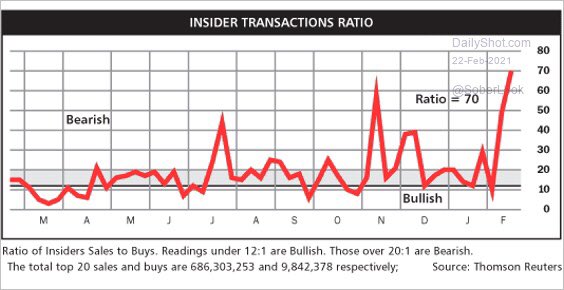
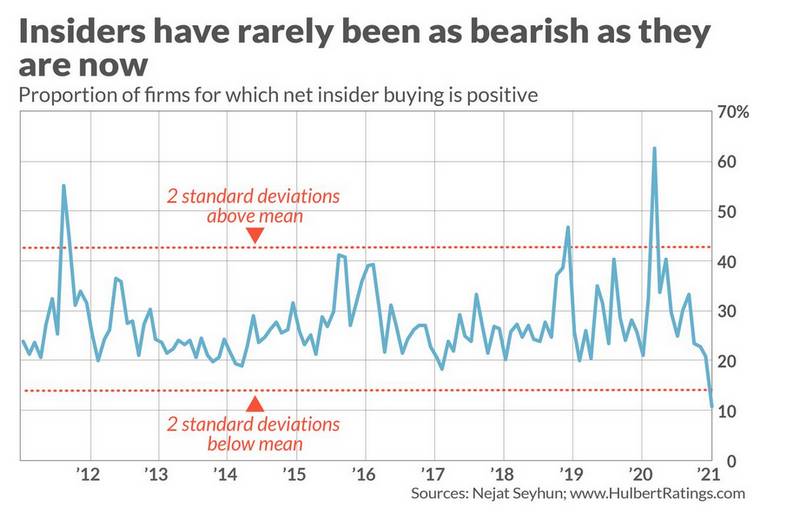
Insiders who know their companies the best are selling shares hand over fist.
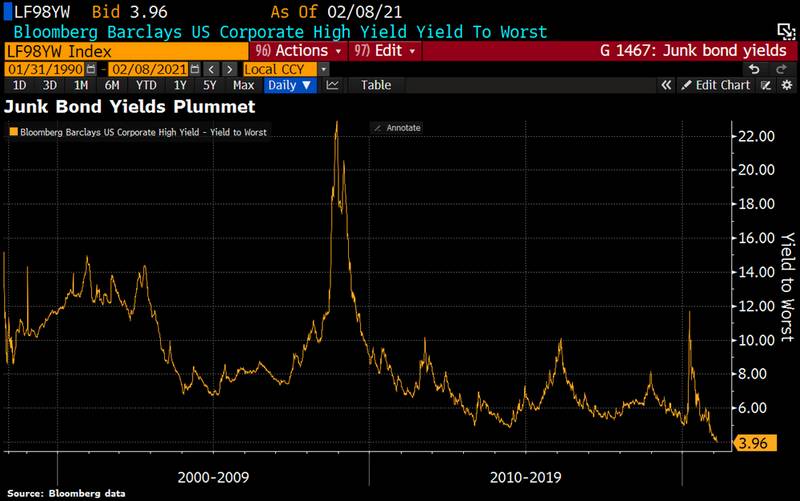
Junk bond yields have plummeted. They are called junk for a reason and investors are scooping them up like there is no risk of default.
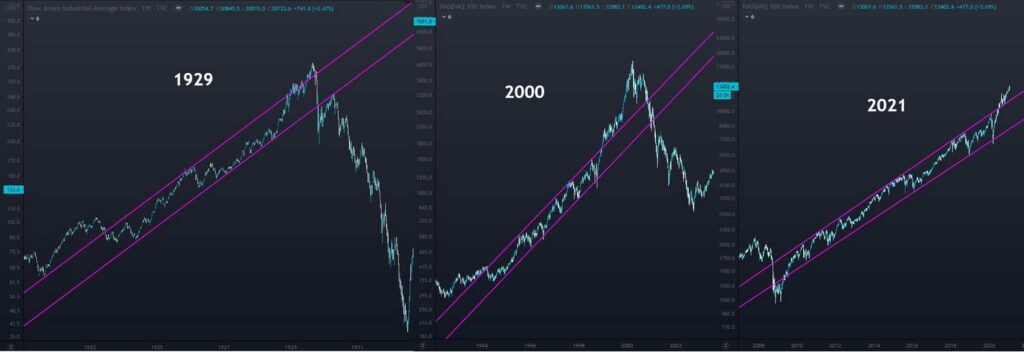
And I generally hate chart comparisons that pull out 1929 bubble charts and try to draw inference that the two situations are the same, because they aren’t. But I wanted to point out that long-term trend lines are a real thing and when long term trend lines are broken, the market has a tendency to revert back inside the channel. It can take a while, but there is asymmetric risk when you are outside the channel. Usually the late stage blow off top exceeds the upper channel before plummeting precipitously.
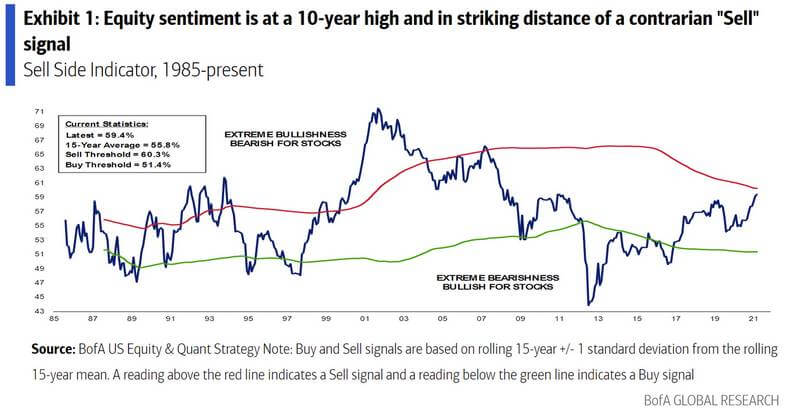
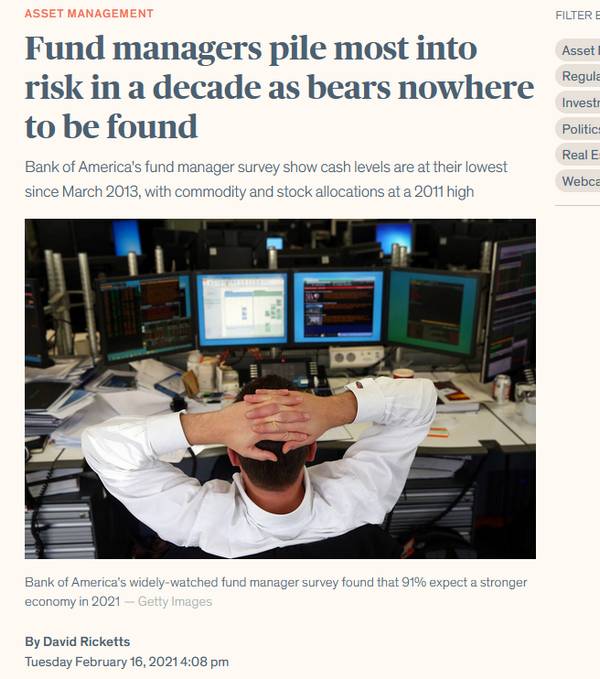
BofA has a sentiment timing model that is relatively pretty accurate. The blue line could shoot far ahead like in the tech bubble however.
Risky asset fund flows are way up over the past year.
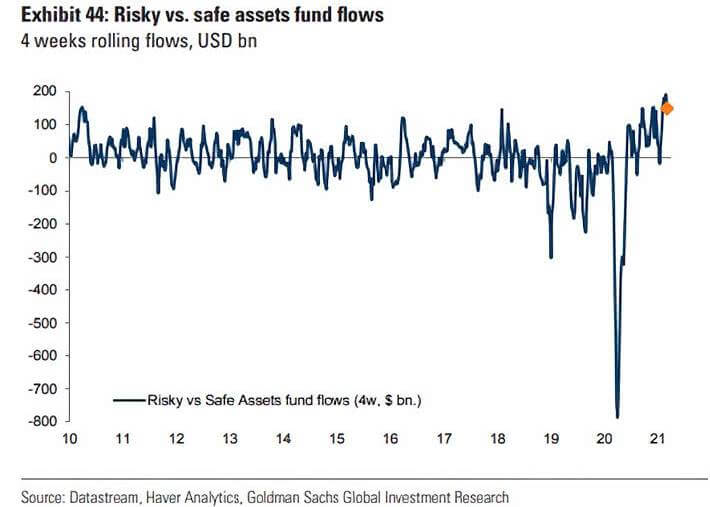
In fact, more money has flown into stocks in the past 5 months than over the last 12 years

America is all in!
Time for that Warren Buffet platitude about greed! I’ll spare you.
But if these aren’t warning signs ominous for the future, nothing else is.
No Two Bubbles Are Exactly The Same
Various people can look at the same data and may come to different conclusions. It think the evidence above is pretty convincing, but there are other pieces of data that can be examined as well.
Plenty of people are comparing this to the Tech Bubble of 1999 in that not every metric is as extreme and therefore the market can continue to rise, but does each characteristic have to match exactly? I don’t think that bubbles have to get bigger and worse on every metric each time compared to history.
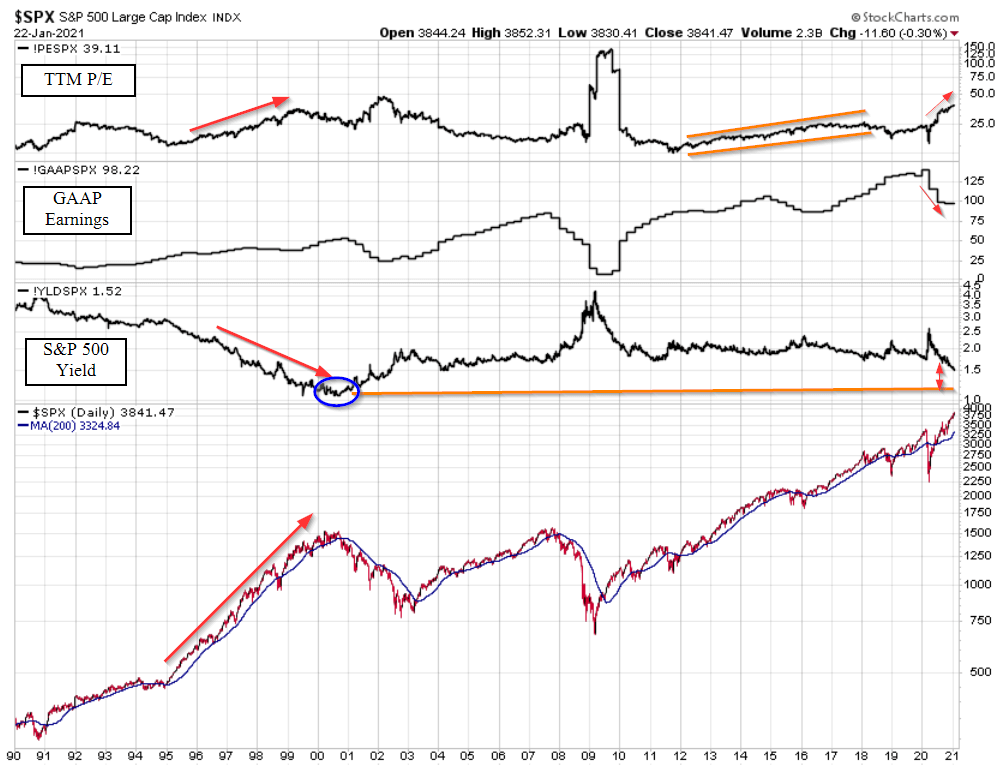
So for instance, while the trailing twelve months Price/Earnings is higher than the tech bubble, the S&P yield is not quite as low as it was then. Which is a better predictor?
Furthermore, the P/E has indicated that the S&P 500 has been overvalued for a number of years now. There is no denying that today’s market is very overvalued and has been driven mostly by P/E expansion, but unfortunately valuation metrics make for poor market timing indicators.
This is why the signs of speculation become important because it’s market top behavior.
Also, this is the first time that a bubble formed in the middle of a recession, which is a novelty.
When Does The Party End?
The stock market risk premium is completely integrated with the valuation you pay and valuation matters in the long term. Either stock values will come down, or they will remain stagnant for a number of years for earnings to catch up. In bubble scenarios, the stock market always corrects violently.
Will the stock market crash today or next week? There is really no way to know how long the speculation will last for and a stock market bubble can continue to get bigger and bigger before it pops.
In the late 1990’s plenty of people had made stock market bubble calls only for the markets to double or triple from that point on. They have a tendency to play out longer than anyone expects.
However, most of the signs that a correction is on the horizon have triggered or are right on the verge of triggering. And given the level of speculation right now, it’s probably going to be a doozy.
The trigger could even stem from all the speculation in Gamestop, AMC, Express that could cause large hedge funds shorting them to sell their other holdings to cover the margin calls. Or who knows perhaps enough hedge funds go bankrupt from their short shares and the clearing firm can’t clear the trades, leading to a bigger systemic financial risk.
When people trade like there is no risk, Mr. Market has a tendency to make people re-evaluate those thoughts in a dramatic way. It doesn’t mean that there is a stock market crash coming, as the 2000’s tech bubble had a pretty orderly deflation over two years. However, the most recent corrections have been pretty violent, with the latest example being the stock market crash of 2020 where the market dropped 35% in a matter of weeks.
What Can You Do About It?
This is ultimately the question, right? You have a few options:
Nothing
If you own primarily index funds, you could stay fully invested and do nothing. There’s nothing wrong with this approach as you’ll ride the wave all the way to the top and then even after a correction, given enough time, you will come out ahead.
Asset managers frequently administer this advice and will never tell you to leave the market because their fees depend on it.
Frequently quoted platitudes are all about “If you had missed the best ten days in the markets over 20 years you’d have lost money” while conveniently leaving out any notion of avoiding any of the worst market days. When there is volatility, those ten best days are also usually near the ten worst days so while you might miss some of the best days you’d probably also miss some of the worst days as well.
Also beating the index is considered a win for them, no matter how much the index has fallen. The champagne corks are popped if their fund loses only 49% next to the S&P 500 losing 50%, but missing out on a 50% run is a career killer.
I used to be a permabull too until a few years ago when I started paying attention to sentiment and started preserving and profiting from market declines.
Switch to Low Volatility Funds
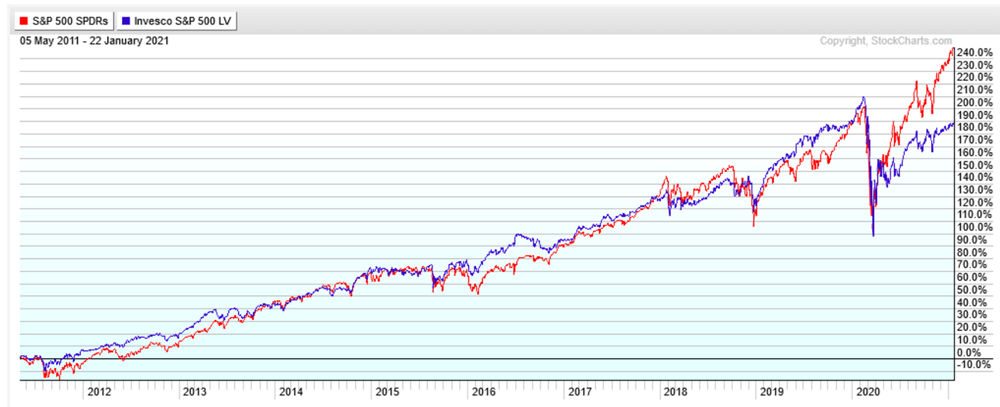
In the past I might have suggested switching over a portion of assets to low volatility funds since for a long time they managed to outperform the S&P 500 with lower volatility, but that whole thesis fell apart in 2020.
In fact, the largest low volatility fund SPLV fell even more than the S&P 500 and then massively underperformed on the way back up. There goes that idea.
Trim Riskier Positions
My favorite of the stock market risk management strategies is to sell the riskiest positions first and raise cash. It’s free.
Some assets have a tendency to fall a lot farther during market corrections than others. Usually they have a high beta, use lots of leverage, or cater to high-yield credit.
Stocks that come to mind are Business Development Companies, Mortgage REITs or tourism industries that are sensitive to recessions.
I’m a big fan of having cash ready to go during market dips so trimming these positions beforehand is a no-brainer.
Consider a Larger Short-Term Bond or Cash Allocation
If you are a millennial like me you probably don’t have any bonds at all. Now is a great time to consider adding some some short-term treasuries (or cash) after selling some common stock. These act as a buoy during periods of market stress.
And when the market dips, you have some dry powder ready to put back into the market.
Or now you can do that home improvement or buy that sports car you’ve always wanted.
And for those in the older generation who are supposed to have a 60/40 mix, equities have far outperformed over the last year, so your asset allocation is likely out of balance anyway. Now is a good time to rebalance your portfolio which would be selling equities and buying bonds.
Hedge Against a Stock Market Decline
This is really where you go if you want to not only protect your capital during a stock market crash, but to also profit from it.
Shorting
Shorting individual stocks is a classic way how to hedge stock market risk, but shorting opens you up to the risk that the stock market keeps going up against you. And with the Reddit message boards coordinating attacks against short sellers and creating short squeezes, it adds another dimension of risk.
Options
On the other hand, buying put and call options can be a great tool in both bull and bear markets if used appropriately and in small amounts. They are flexible instruments that allow you to change the payout structure of a stock market move. In the simplest case, you can wager that the stock market goes up or down, but you can also bet that the market moves by a specific amount, either a lot or a little.
Options get the reputation of being ultra risky because speculators have a tendency to use them in the riskiest of ways possible that usually results in a 100% loss of the option premium. The Robinhood portfolio chock full of deep-out-of-the-money call options I showed above is an example of that where the strike price (the threshold that the stock must clear before earning any profit) is 50-100% above the current stock price.
And because options aren’t free, if you are buying puts and spreads for protection, it only makes sense to allocate 1-2% of your portfolio to them during the final stretch of the market run. I don’t think it makes much sense to spend money to protect a position in your portfolio when you can just sell the asset or use a trailing stop loss for the same effect (unless you aren’t willing to sell for tax considerations).
I buy stock market hedges for the S&P 500 index, but I also go with a targeted approach to high flying “innovation stocks” that won’t be profitable for a few years and firms that invest in junk debt. Often these go down much harder when the “final fantasy” starts turning into a nightmare.
Remember that there’s a good chance that you’ll be early and have to buy new ones when the old ones expire, so this is why I suggest only buying a small percentage of puts for your portfolio and first selling riskier positions to raise cash. Raising cash is free and you will have to buy a tremendous number of puts to fully indemnify your portfolio if you skip that step.
I Started Hedging in 2021
I started hedging my portfolio and reducing risk around the end of the first quarter of 2021, given all the various signs of a market top we discussed above. I was early and the market kept going until the end of the year, but as I write an update a year later in May, the market is lower than it was back then.
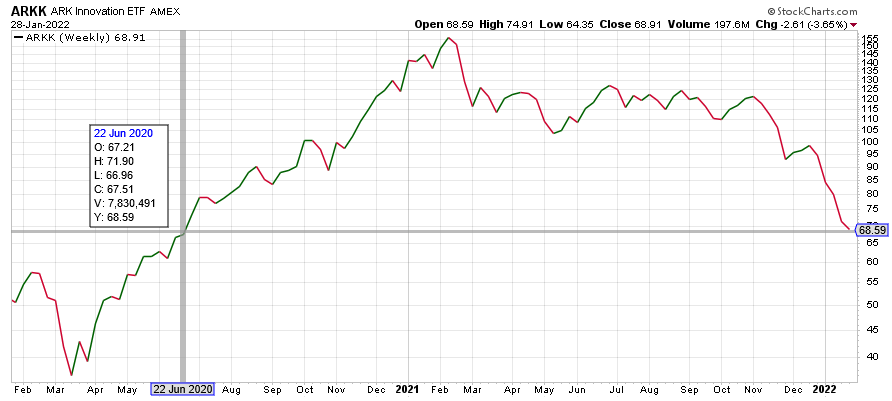
The riskiest stocks that ARKK targets turned out to be a great call because their fund peaked about a month after I wrote this article and they are now down 50% and back to June 2020 levels. A fund SARK was introduced in Nov 2021 that takes the inverse side of the ARKK bets and it’s up over 100% since inception.
I’ve only ever timed one market collapse event on the first try with the 2018 Volmageddon explosion. I bought my hedges and within 2 weeks the market fell apart and I made a 20x return on a single trade. That’s definitely not the norm.
On one hand you can keep waiting and waiting until the market plummets right before your eyes and you have no protection at all in your portfolio. Or you can evaluate the signs of a market top, keep some cash on the sidelines, and start incorporating some hedges into your portfolio now. You aren’t betting the farm that you’ll be right on the timing, because usually you can’t be, but you are just adding some hedges that you might be.
The Catalyst
Ultimately the market needs a catalyst. Some piece of bad news, or news that gets people to realize the best case scenario they thought was going to happen will no longer happen. News like that is random and can come at any time.
My call about inflation being non-“transitory” has proven to be correct but the market shrugged it off for months because the Federal Reserve kept selling a bunch of lies about it being transitory. As such, the Fed usually is slow to react and ends up creating a bigger problem than if they would just act accordingly. Even in May 2022, they are still behind the curve.
The catalyst might even be in the form of a black swan, where something completely unexpected like China declares war on Taiwan, or Geo-political tensions increase in the middle east. As we saw, Russia invaded Ukraine and that led to some market turmoil and higher energy prices.
We’ve so far seen that the vaccines only have limited use against some older strains of the virus but luckily the newest strain is mild, so that bullet appears to be dodged.
But it’s always better to be thinking about a major market correction before it happens and potentially have some preparation built into your portfolio than being caught flat-footed and panic selling when the pain becomes too great. That is a lesson I have learned a few times in my 25 years of investing and I hope that insight helps you.
Add your thoughts to the comments below.
Free Investing Tools
For advanced traders who want direct access to exchanges without “payment for order flow” shenanigans choose Interactive Brokers.
I use Axos Bank for its no-fee business account with free bill pay.









This analysis is very helpful, but there is one factor not considered. As the National Debt has nearly TRIPLED in the last 12 years, if interest rates were to rise, the interest on the National Debt would impose a crippling burden. Thus, interest rates CANNOT rise to stave off inflation … thus MAJOR inflation is coming. So the idea of holding cash or bonds is less appealing. At least corporate profits should self-adjust for inflation. I’m not offering a solution: just pointing out the problem of unprecedented risk of major inflation.
I do agree and in fact I think inflation is already here if you look at the underlying cost of commodities. The Fed has planned to not raise rates until 2022, but I think their hand will be forced much sooner, probably even by the end of the year. The Core Chained CPI vastly understates real world inflation because they exclude real costs that Americans actually face like food and energy. I feel the Fed is politicized much now and the dual mandate is conflicting ideology, so inflation might really overshoot before they get a handle on it.
However, I do agree with you that there aren’t many places to put cash without getting eaten by inflation. Most assets are bid up, but the expectation is that there will be a big enough correction to make up for the 5% or so inflation loss of holding cash, especially when interest rates increase. Of course I’m not saying that anyone should hold 100% cash, just some dry powder to buy when a flash sale materializes.
A lot of commodity stocks look enticing here and I have been reallocating the non-cash portion into those.